Category Archives: design

Handouts? …you don’t need no stinkin’ handouts!

Today I perused the evaluations that my students submitted for last semester’s Introduction to Interactive Design course. Nobody’s perfect: some of the criticisms are valid. Often I’ll get one or two evaluations that say I’m the best, and one or two who say I’m the worst. This time was no exception, but I also noticed a number of instances of “we need handouts” in the comments section of the forms. Normally when I get five or six students saying the same thing, I take notice. But this time I thought: “Come on, you’ve got to be kidding me…”

The course is a basic boot camp for XHTML and CSS. It’s fairly straightforward and as long as the students tackle each weekly assignment, they will keep up. It isn’t rocket science, but students have to do the work, and for a 3-credit course, students are expected to spend around 6 hours out of class working on their assignments.

As time has gone by, I’ve noticed that the students’ expectations are changing. They are much more demanding, for one, and much less willing to accept that they need to work to find the answers to questions posed by the instructor. Whereas students a decade ago were willing to get their hands dirty, experimenting, discovering, and finding things out on their own, more and more students today are expecting us to give them the answers “on a silver platter.” Hey, Teach–you showed me, but I was up really late last night and I sort of dozed off in class so I didn’t take any notes. Can you give me a handout?

You want a handout? I’ll give you one better. I’ll let you in on a little secret: Google. Heard of it? It’s really cool…

If you forget how to add an image to your HTML page, try googling “image html” and you’ll see that there are 264 million results just waiting for you; ALL of the ones on the first page tell you how. Take your pick. If you forget about server side includes, try googling “server side includes” and you’ll get about a million results. And for the skeptical among you, I can assure you that all of the results on the first page are relevant matches for what you were asking for!

What? You say that you don’t like reading? [ sigh ] Ok, here’s another little secret: YouTube. Don’t tell anyone or you’ll spoil it. Search for “server side includes” in YouTube, and the top result is a 7-minute tutorial on server side includes.

So please. Don’t ask for handouts. That’s so 1990’s.

Q: When Does “Quality” Mean “Low Quality”?

A: When you work for a North American governmental environment agency.

The “Air Quality Index” is used by the EPA, Environment Canada and other agencies to communicate air quality to the general public. Unfortunately, the term is counter-intuitive: in the up-means-down world of the environmental bureaucracy, the higher the number, the lower the quality! The graph attempts to mitigate the confusion by adding the term “risk”, but in doing so it merely compounds it. The result is confounding and unnecessarily complicated to understand.

The colour coding on the graph is also visually misleading: It goes from blue (cold) to red (hot). Is this a temperature graph–or does this mean the air is better when it’s colder? The graph probably should go from green (good) to red (warning/bad). Somebody should do something!

Asian countries, on the other hand, use “API” (Air Pollution Index), where higher numbers communicate higher pollution. This makes perfect sense to me, and I don’t know why our bureaucrats seek to bury the information in doublespeak, especially when we actually have better quality air than they do in much of Asia.

Here’s the explanation from Environment Canada:

Here’s what the readings mean:

  • If the air quality value is 25 or less, the air quality is considered relatively good.
  • If the AQI value is in the range of 26 to 50 (fair category), there may be some adverse effects on very sensitive people.
  • An index value in the 51 to 100 range (poor category), may have some short-term adverse effects on the human or animal populations, or may cause significant damage to vegetation and property.
  • An AQI value of more than 100 (very poor category) may cause adverse effects on a large proportion of those exposed.

Notice that the explanation refers to “fair category” (another attempt at mitigating the confusion that’s caused when you try to combine the words “high” and “quality” to convey “low quality”) but this is not expressed in the graph.

So am I missing something? Why does Environment Canada do this, other than to repeat the mistake of the EPA? Is there a scientific reason?

What I did on my Summer Vacation

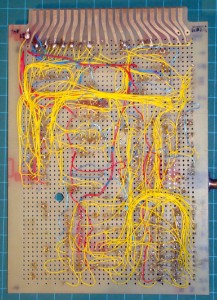
One of my projects, circa 1983

In 1980, just after I graduated from York University with an MFA, I took up electronics. I was working part-time at a private radio station about an hour’s drive from Toronto; this radio station was one of the first in the world to go fully automated in the early 1970’s. Today automation in broadcasting is a given, but at that time it was a big deal. My job was to “program” the machine they called “OTTO” so that it could run overnight without any human intervention. Programming involved selecting square aluminum wafers of different colours that were about 8cm square, with 5mm holes bored through them. One colour square represented a music selection, a different colour represented a commercial, and another represented a weather report. I had to stack these about a hundred high in a holder according to the station log, which determined what advertisement should go when. Heaven help you if you did not close the stack holder properly–the squares might land in a pile all over the floor.

I got curious about electronics because at the time the station converted OTTO from a mechanical system to an electronic system–which meant that instead of stacking squares of metal, you stood in front of OTTO and punched in the program using a keypad.

I was interested in electronics because I wanted to create interactive box/sculptures that changed with human presence. I dove into the subject and although I was in some ways greatly hampered by a lack of mathematical skills, I became quite a competent designer of digital gizmos. I even built several microcomputers, one using the RCA 1802. My first entree to programming was flipping switches on this single board computer to make an LED flash on and off.

When the Macintosh came along, my interests moved elsewhere, and for the past fifteen years, until this year, I have been largely focused on interactive media using the web. My electronics workshop remained in boxes from 1985 to this past July, when I set things up again, and bought some new gear and new parts.

One of the parts I purchased was a microprocessor called the Arduino. It’s an open source prototyping computing platform used by many artists and designers around the world.

I’m still interested in human interaction with computers; I want to try to meld old interfaces and traditional materials with computers. One thing that will help me in my quest is a new service called “Pachube” (pronounced ‘patch-bay’): Pachube is “a service that enables you to connect, tag and share real time sensor data from objects, devices, buildings and environments around the world. The key aim is to facilitate interaction between remote environments, both physical and virtual.”

In my current experiment, I have connected some sensors to an Arduino, and the Arduino sends the sensor data to my home computer, which uploads the data to Pachube, which makes it available to others online. In this case, a widget called PachuDial takes the data and makes a Flash-enabled dial, which updates every few minutes on this blog. I could Twitter this information, and I can plot it to my home virtually on a Google SketchUp model, and publish my virtual home online (if I wanted). To see the most advanced work from Pachube, view this YouTube video.